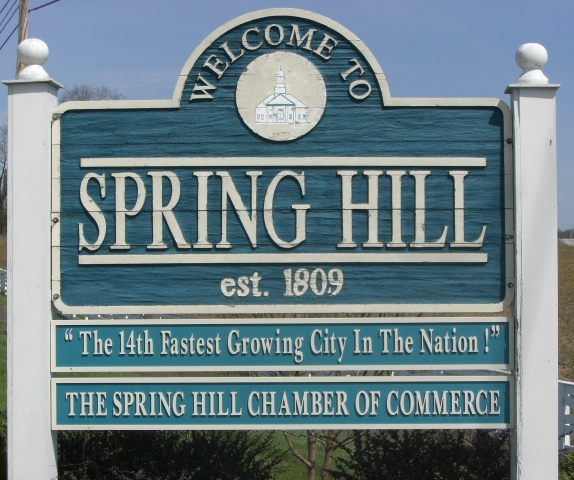
With the Spring Hill population growing steadily each year, has the crime rate gone up or down in the last 5 years? Below we list some crime tables and graphs to help solve this question.
The Tennessee Bureau of Investigation has published crime reports through 2014 on their site.
Reported Group A Offenses:
| Spring Hill | 2010 | 2011 | 2012 | 2013 | 2014 |
|---|---|---|---|---|---|
| Population | 29,036 | 29,735 | 31,140 | 32,576 | 32,053 |
| Total Offenses | 1255 | 1123 | 1030 | 929 | 988 |
| Adult Arrests | 248 | 180 | 194 | 174 | 230 |
| Juvenile Arrests | 48 | 40 | 42 | 64 | 63 |
Type of Offenses:This table highlights burglaries, Grand Theft Auto, narcotic violations, simple assault, and vandalism –these offenses typically had the highest number of reported incidents over the years.
| Spring Hill | 2010 | 2011 | 2012 | 2013 | 2014 |
|---|---|---|---|---|---|
| Burglaries | 73 | 63 | 71 | 33 | 48 |
| Grand Theft Auto | 136 | 78 | 93 | 71 | 91 |
| Narcotic Violations | 105 | 108 | 74 | 67 | 76 |
| Simple Assault | 196 | 162 | 178 | 163 | 193 |
| Vandalism | 228 | 176 | 145 | 117 | 96 |
You can get more information at tbi.tn.gov.
See also an overview of Williamson County crime over the last 5 years as well as statistics for each city below:
A Look at Williamson County Crime From 2010 to Present


