
How has the crime rate changed in the last 5 years in Fairview? The tables and graphs below help illuminate what offenses are on the rise. These reports are from the Tennessee Bureau of Investigation, which have published crime reports through 2014 on their site.
Reported Group A Offenses:
| Fairview | 2010 | 2011 | 2012 | 2013 | 2014 |
| Population | 7,720 | 7,720 | 7,947 | 7,993 | 8,086 |
| # of Offenses | 339 | 374 | 392 | 448 | 459 |
| Adult Arrests | 124 | 130 | 152 | 178 | 238 |
| Juvenile Arrests | 5 | 9 | 16 | 14 | 21 |
Types of Offenses:
This table highlights some of the offenses including: burglaries, theft from motor vehicle, narcotic violations and simple assault–these offenses typically had the highest number of reported incidents over the years.
| Fairview | 2010 | 2011 | 2012 | 2013 | 2014 |
| Theft from Motor Vehicle | 40 | 14 | 36 | 4 | 14 |
| Burglary | 23 | 21 | 24 | 18 | 11 |
| Drug/Narcotic Violations | 32 | 39 | 43 | 91 | 95 |
| Drug/Narcotic Equipment Violations | 22 | 30 | 33 | 82 | 66 |
| Simple Assault | 59 | 80 | 59 | 47 | 66 |
The above table is just a sample of offenses in Fairview. You can get more information about other offenses at tbi.tn.gov.
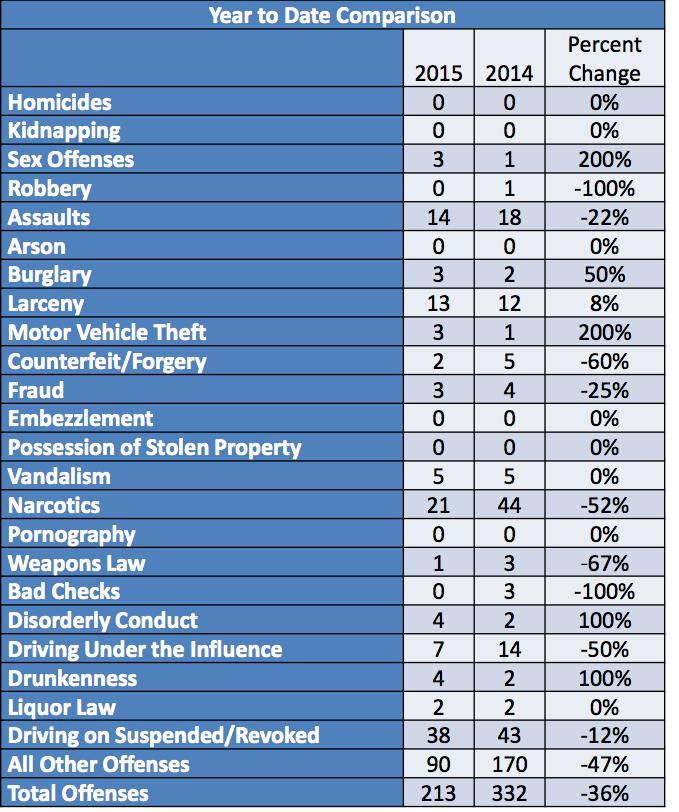
Below is a graph from the City of Fairview March Monthly Report, detailing the number of crimes in March of 2015, comparing it to March 2014.
See also an overview of Williamson County crime over the last 5 years as well as statistics for each city below:
A Look at Williamson County Crime From 2010 to Present
Franklin
Brentwood
Nolensville
Spring Hill


