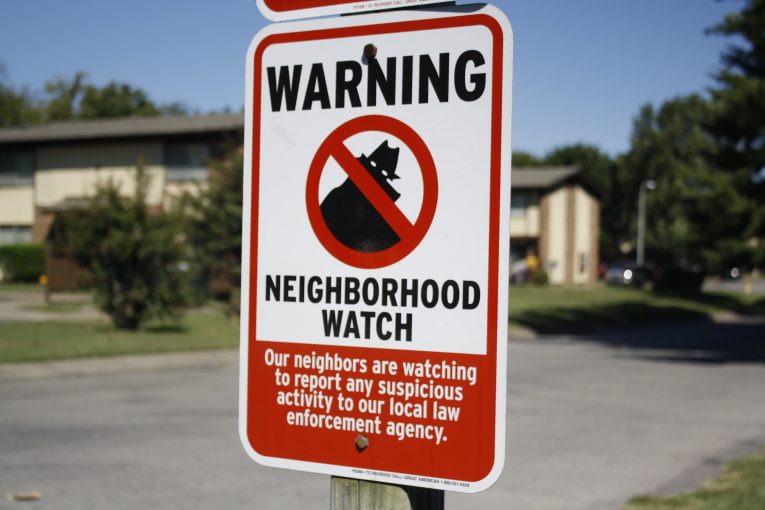
Comparing the F.B.I.’s recently released report of crime from last year to its report from 2014, violent and property crimes in Williamson County cities increased, while in the state as a whole those crime rates fell.
| Year | Total | Violent Crimes | Property Crimes | |
| County total | up 6.7% | up 19.6% | up 5.4% | |
| 2014 | 2539 | 249 | 2290 | |
| 2015 | 2711 | 298 | 2413 | |
| Brentwood | up 2.7% | down 11% | up 3.4% | |
| 2014 | 374 | 19 | 355 | |
| 2015 | 384 | 17 | 367 | |
| Franklin | up 10% | up 53% | up 6.8% | |
| 2014 | 1089 | 99 | 990 | |
| 2015 | 1209 | 151 | 1058 | |
| Spring Hill | up 14.3% | up 35% | up 12% | |
| 2014 | 376 | 37 | 339 | |
| 2015 | 430 | 50 | 380 | |
| Nolensville | up 10.6% | up 16% | up 9% | |
| 2014 | 66 | 6 | 60 | |
| 2015 | 73 | 7 | 66 | |
| Fairview | up 44% | down 54% | up 74.4% | |
| 2014 | 115 | 29 | 86 | |
| 2015 | 166 | 17 | 149 | |
| County | down 13.5% | down 5% | down 10.1% | |
| 2014 | 519 | 59 | 460 | |
| 2015 | 449 | 56 | 393 | |
| TN city average* | down 7.9% | down 11% | down 6.9% | |
| 2014 | 794.6 | 142.4 | 652.2 | |
| 2015 | 734.9 | 126.5 | 607.3 | |
*Using the 230 municipalities in the state
Please join our FREE Newsletter


