
It’s been a full year since COVID-19 came into our lives. March 5, 2020, was the exact date the first case of COVID-19 was detected in Tennessee, the first case in the state was detected in Williamson County.
From February 17 through March 3, we hosted a survey asking you, our readers, how COVID-19 has affected you and your family over the last year. We asked questions on a variety of topics from job status to mental and physical health, to schooling and what you look forward to most as day-to-day life approaches a “new normal.” We received over 1,000 responses and today, we are sharing those results. Also, over the next several weeks, we will explore these topics a little deeper in our series “COVID-19: 1 Year Later.”
COVID-19 Cases (Testing Positivity, Symptoms, Deaths)
As of the writing of this article, Tennessee has over 794,000 total cases of COVID-19 and Williamson County has almost 26,000 total cases, according to the Tennessee Department of Health.
Of our survey respondents:
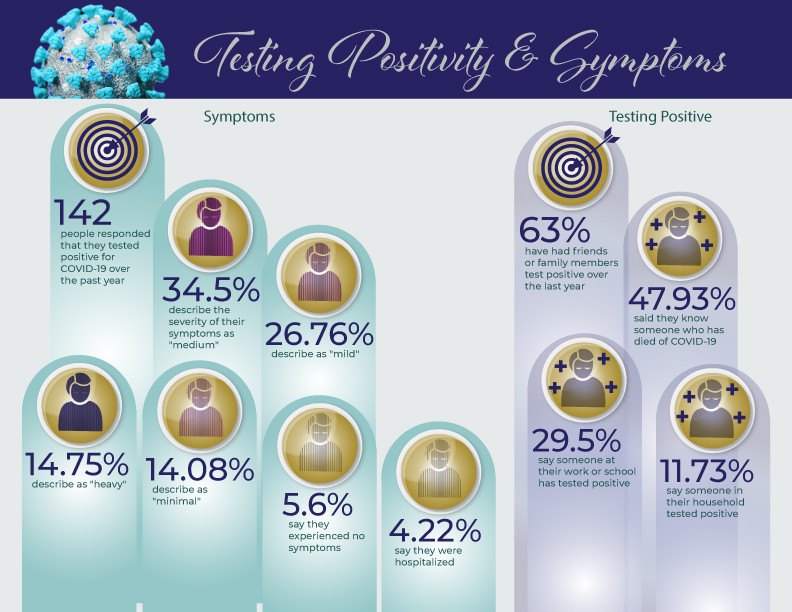
- 13% tested positive
- 63% had a friend or family member (not living with them) test positive
- 11.73% had someone in their household test positive
- 29.5% had work or school peers test positive
Over 11,000 Tennesseans have died due to COVID-19, according to the Tennessee Department of Health, and 208 of those were Williamson County residents.
- 47.93% of our survey respondents said they knew someone who died of COVID-19.
Of those who tested positive, a majority experienced mild to medium symptoms, with 5% experiencing no symptoms at all and 4% requiring hospitalization.
Concern Regarding Contracting COVID-19
Our reader survey showed that our readers are more concerned than less concerned about contracting COVID-19.
On a scale of 1-5, with 5 meaning very concerned and 1 meaning not concerned at all, here is how our readers answered:
1 – 18.5%
2 – 12.19%
3 – 22.36%
4 – 25.2%
5 – 21.72%
Vaccination
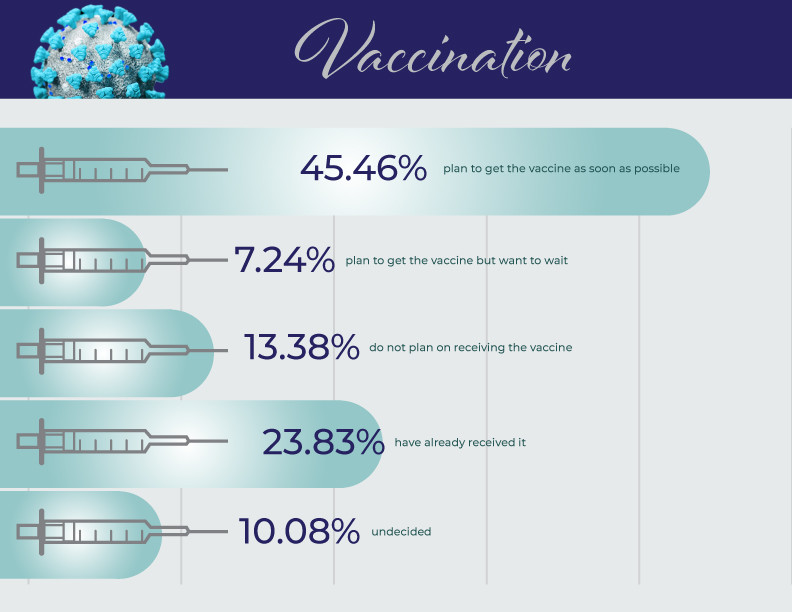
Over 45% of survey respondents say they plan on getting the COVID-19 vaccine as soon as possible, while a smaller percentage says they will get it but want to wait and a little over 13% say they do not plan on receiving the vaccine.
Job Status
For many, COVID-19 affected their work status, either temporarily or permanently. The majority of our survey respondents said they experienced a cut in their work hours.
Our survey respondents said:
- 40% report a cut in work hours
- 25% furloughed
- 21% laid off
- 12% laid off temporarily
- 30% transitioned to working remotely (and 24% said they prefer working from home)

Small Business
About 12% of our survey respondents said they are small business owners.
When asked how the pandemic has affected their business on a scale of 1-5, with 5 meaning devastated their business and 1 meaning affected their business a little, here is how local small business owners answered:
1 – 23.43%
2 – 15.62%
3 – 20.31%
4 – 20.31%
5 – 20.31%
Many small businesses in Williamson County and throughout middle Tennessee were forced to close their business, at least temporarily and lay off staff. For those small business owners who answered our survey:
- 37.5% – closed temporarily
- 2.3% – closed permanently
- 60.15% – did not close
- 15% – laid off staff temporarily
- 7% – laid off staff permanently
- 81.25% – did not lay off staff
Schooling
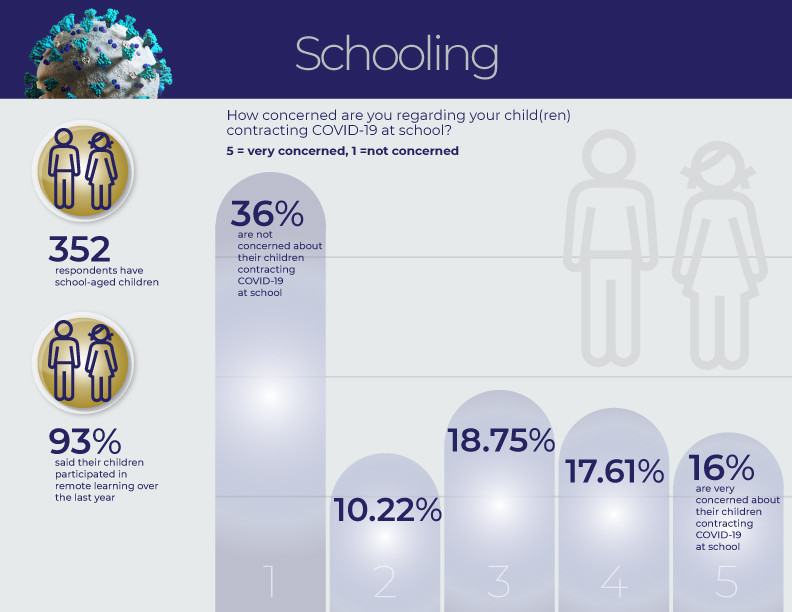
32% of our survey respondents have school-age children and a huge majority (93%) participated in remote learning over the last year.
The majority of those with school-age children are not concerned that their child(ren) will contract COVID-19 at school, with 36% not concerned at all and 16% very concerned.
The Arts
About 5% of our survey respondents said they work in the arts.
When asked how the pandemic has affected their work on a scale of 1-5, with 5 meaning devastated their work and 1 meaning affected their work a little, here is how local artists answered:
1 – 9.25%
2 – 1.85%
3 – 20.37%
4 – 22.22%
5 – 46.29%
Physical & Mental Health
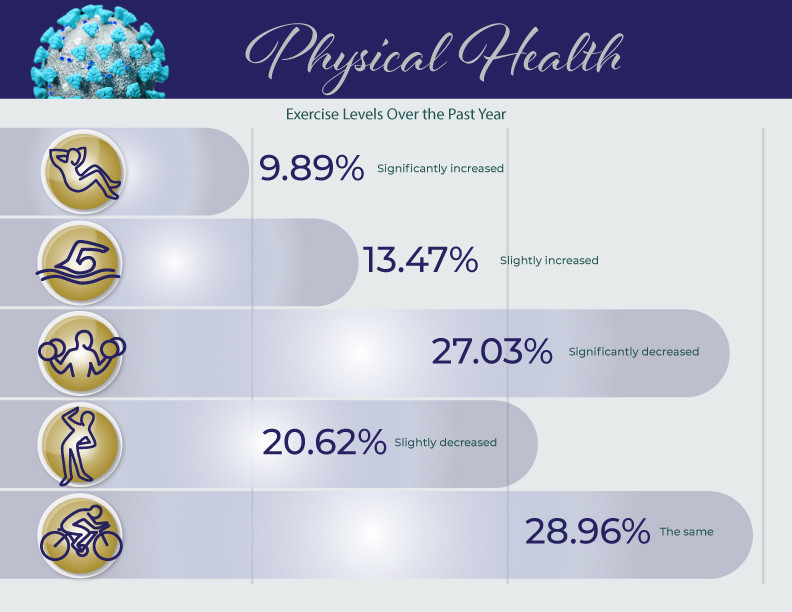
Last spring, gyms closed for a temporary time, resulting in less physical activity for some. While many ventured outside for exercise, most of our survey respondents report that their exercise levels have decreased or stayed the same since last year.
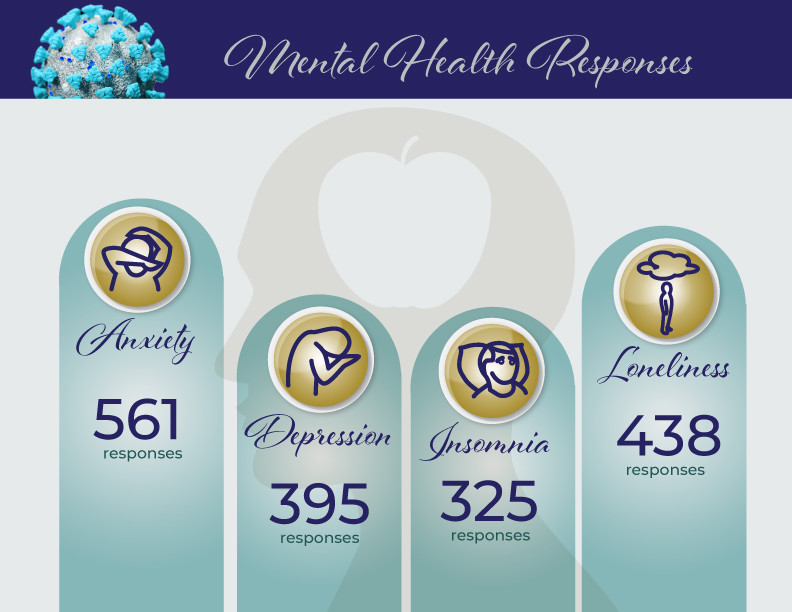
With stay-at-home orders, the cancelation of many events, limited gatherings and the many other stressors that occurred over the last year, mental health became a major concern during the pandemic.
For our survey respondents, anxiety was a top issue, as well as, feelings of loneliness.
*If you or someone you know is facing depression, anxiety, grief, addiction or thoughts of suicide, Find Hope Franklin can connect you to the help you need.
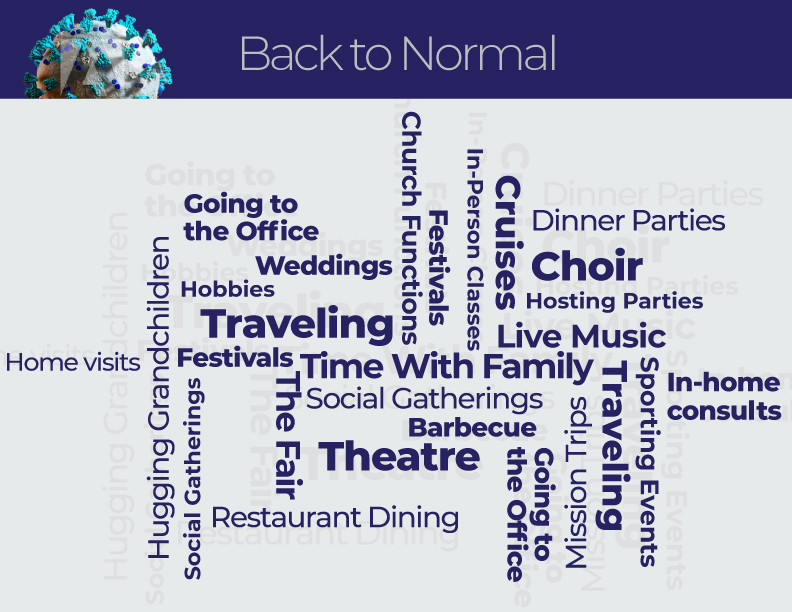
Back to Normal/New Normal
Our survey respondents shared some of the things they are looking forward to the most as things return to “normal” or we begin a “new normal.” Things like being with family and friends, traveling, having social gatherings, attending weddings and church functions, going to sporting events and festivals are among the things our survey respondents have missed the most over the past year.
Travel
When asked what our readers are looking forward to doing the most as things return to “normal,” travel was a popular theme. From traveling to another state to visit family to business trips to big international vacations, it is clear that many are looking forward to the ability to travel.
- 76.71% of our survey respondents said they canceled travel plans over the last year due to COVID-19.
Over the last year, travel by car exceeded airplane travel.
- 65.26% traveled by car
- 25.93% traveled by air domestically
- 2.1% traveled by air internationally
The Holidays
While COVID-19 greatly affected travel plans over the last year, another major disruption was the holidays. Many people canceled travel plans and holiday gatherings and pivoted to smaller gatherings and celebrated the holidays via Zoom.
When asked how COVID-19 affected holiday plans on a scale of 1 – 5 with 5 meaning severely affected and 1 meaning affected very little, here is how our survey respondents answered:
1 – 14.48%
2 – 6.32%
3 – 14.84%
4 – 20.34%
5 – 44%
Dining at Restaurants
Many of our survey respondents commented that they look forward to dining in at restaurants more as things return to “normal.”
When asked how comfortable you are dining in at a restaurant on a scale of 1-5 with 5 meaning very comfortable and 1 meaning not comfortable, here is how our survey respondents answered:
1 – 28.41%
2 – 11.73%
3 – 17.78%
4 – 20.80%
5 – 21.26%
Survey respondents have preferred ordering takeout over dining at a restaurant:
Takeout – 48.67%
Indoor Dining – 24.01%
Outdoor Dining – 15.94%
Delivery – 11.36%
 More Coronavirus Stories
- Williamson County Coronavirus Case Count June 25, 2022
- WCS COVID-19 Isolation and Quarantine Numbers by School March 10, 2022
- Williamson Medical Center Update on COVID-19 Hospitalizations: February 24 February 25, 2022
- How Many Williamson County Residents Have Received COVID-19 Vaccine? February 21, 2022
- Williamson Medical Center Update on COVID-19 Hospitalizations: February 17 February 18, 2022
- How To Avoid Buying Fake COVID Tests Online February 15, 2022


